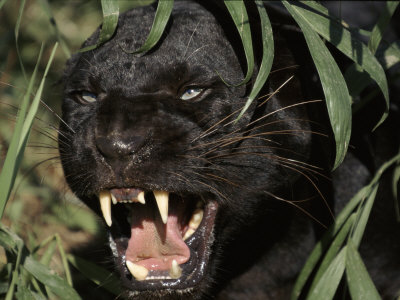
My favorite animal is definitely the black panther. In actuality however, it's really just a melanistic color variant from many species of large cat. This can include cougars, leopards or jaguars. I've always loved this animal and would love to learn something this year about them if possible.
Wednesday, August 31, 2011
Tuesday, August 30, 2011
3 Map Types
This first map is an isarithmic map showing the average annual temperatures of the United States. Isarithmic maps are used a lot as weather maps to show temperature, rainfall etc.
This next map is a choropleth map showing all the hay grown in the United States in the year 2002. Choropleth maps are used mostly to show density such as in population and per-capita income.
The final map here is a dot density map showing the statewise population of the United States in 1999. Dot density maps use circles or "dots" to show the presence of something, either a feature or population.
Subscribe to:
Posts (Atom)